CycleGAN_ssim
Comparing different similarity functions for reconstruction of image on CycleGAN. (https://tandon-a.github.io/CycleGAN_ssim/) Training cycleGAN with different loss functions to improve visual quality of produced images
Similarity Functions
Generative Deep Learning Models such as the Generative Adversarial Networks (GAN) are used for various image manipulation problems such as scene editing (removing an object from an image) , image generation, style transfer, producing an image as the end result.
To improve the quality of these generated images it is important to use an objective function (loss function) which is better suited to human perceptual judgements. In this post, I would present a brief overview of different loss functions used for this task.
The Notorious L2 Loss
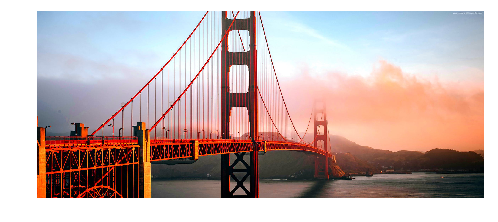
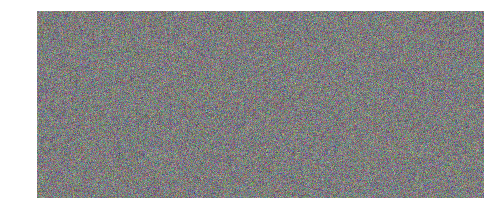
According to error sensitivity theory, a distorted image is seen as a sum of the undistorted image and an error signal.
| Undistorted Image | Error Signal | Distorted Image |
|---|---|---|
 |
 |
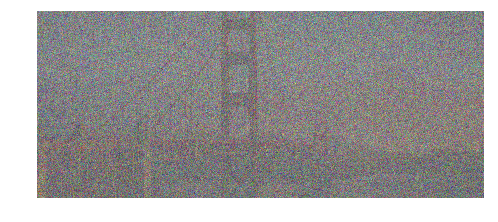 |
Figure 2: Distorted Image = Undistorted Image + Error Signal
Loss in quality of an image is thus assumed to be related to the visibility of the error signal. L2 loss tries to quantify this error signal by taking the mean of squared difference between intensities (pixel values) of the distorted and the undistorted image.
Formula 1: L2 loss
L2 loss has been the de facto standard for the industry for quite a long time now and this is mainly due to the following reasons -
- It is simple and inexpensive to compute.
- Additive in nature; error due to independent distortions can be added together.
- It is convex, symmetric and differentiable, making it a good metric in the context of optimization.
- Provides the Maximum Likelihood estimate when noise is assumed to be independent and identically distributed following a Gaussian distribution.
Due to its simple structure, researchers have used l2 loss in all types of problems, from regression to image processing.
L2 loss assumes that pixels or signal points are independent of each other whereas images are highly structured - ordering of the pixels carry important information about the contents of an image. For a given error signal, L2 loss remains the same irrespective of the correlation between the original signal and the error signal even though this correlation can have strong impact on perceptual similarity.
Failure of these assumptions makes L2 loss an unsuitable candidate to improve the quality of generated images.
SSIM Loss
Loss in quality of an image is thus not only related to the visibility of the error signal. Contrary to the L2 loss, the structural similarity (SSIM) index provides a measure of the similarity by comparing two images based on luminance similarity, contrast similarity and structural similarity information.
Formulation:
Luminance of an image signal is estimated by mean intensity.
Formula 2: Mean Intensity [1]
Luminance of two images is then compared by
Formula 3: Luminance Similarity [1]
Contrast is determined by difference of the luminance between the object and other objects in the field of view. This is done by calculating the standard deviation of the image signal.
Formula 4: Contrast of image signal [1]
Contrast similarity is then found out by,
Formula 5: Contrast Similarity [1]
Structural information is represented by strong inter-dependencies between spatially close pixels. Normalizing the incoming signals by first subtracting mean intensities and then dividing by respective standard deviation projects the image signals as unit vectors on hyperplanes defined by,
Formula 6: Hyperplane [1]
These unit vectors are associated with the structural information.
,
where
, gives the corelation between the two windows x and y.
Formula 7: Structural similarity [1]
SSIM Index is computed by taking into account the luminance, contrast and structural similarity. The constants C1, C2 and C3 are used to resolve cases where in denominator is tending to zero.
Formual 8: SSIM [1]
SSIM index is calculated as a local measure rather than a global measure in order to incorporate the fact that the human visual system (HVS) can perceive only a local area at high resolution at a time. In the above formulas x and y are windows on the full images X and Y (test/predicted image and reference image)
In comparison to L2 loss, SSIM index is a better image quality measure as it is better suited to the HVS. The following figure shows that SSIM index varies for different distortions while L2 Loss remains constant, showing superiority of SSIM index over L2 loss.
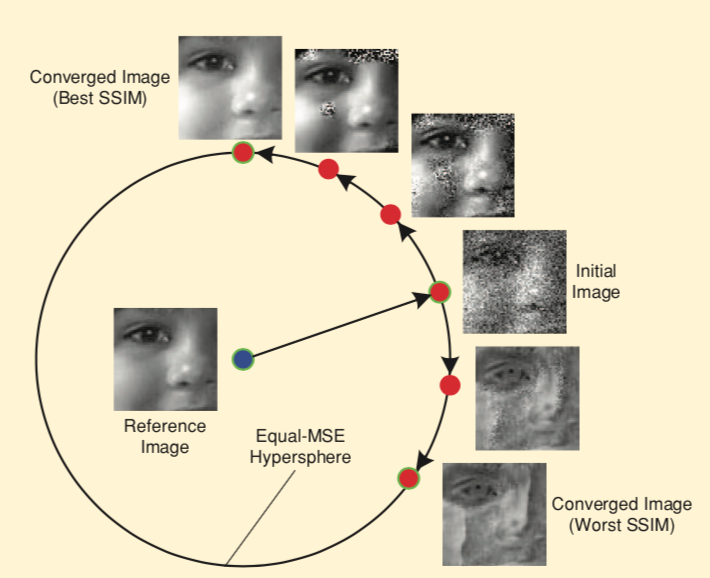
Figure 3: Comparison of SSIM Index with L2 Loss as similarity measure [2]
To take into account the scale at which local structure of an image is analyzed, researchers came up with a multi scale version of SSIM index, MS-SSIM. This is calculated by computing the SSIM index at various scales and then taking a weighted average of the computed values.
SSIM loss given by, 1 - SSIM Index, is used as the objective function for DL models.
While SSIM loss may seem more suitable as compared to L2 loss, it was designed for grayscale images and sometimes fails in estimating quality of color images. Training DL models with SSIM loss can lead to shift of colors.
To overcome this issue of SSIM loss, neural nets can be trained with a combination of different losses.
Formula 9: Combined Loss Formula [3]
Here is a Guassian Window and
is a small number (0.84) to weight the different loss functions involved. Guassian window is used to make L1 loss consistent with the MS-SSIM loss, in which the error at pixel q is propogated based on its contribution to MS-SSIM of the central pixel.
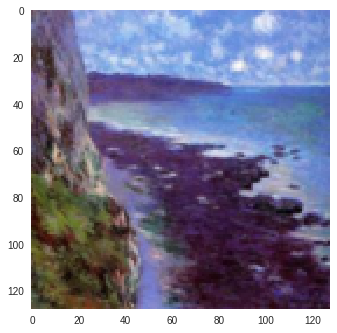
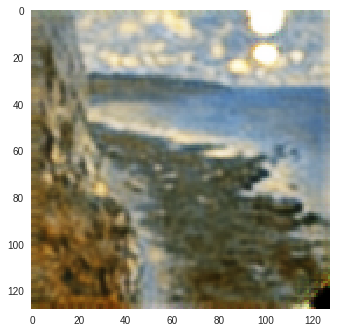
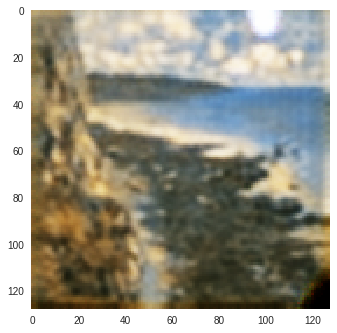
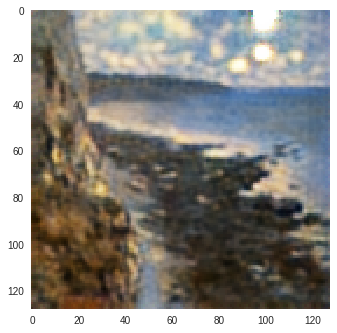
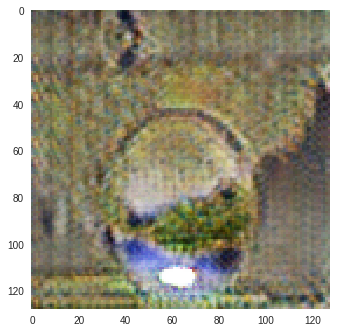
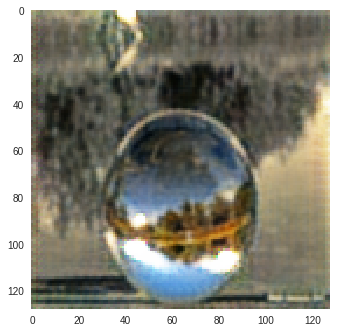
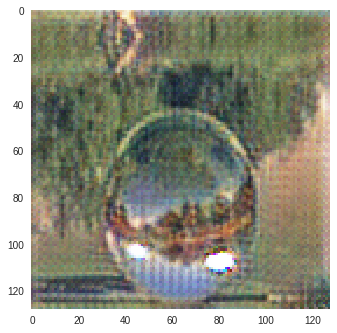
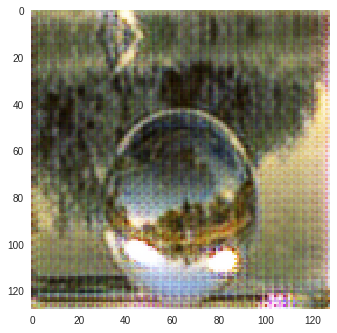
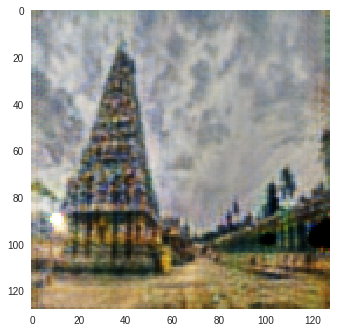
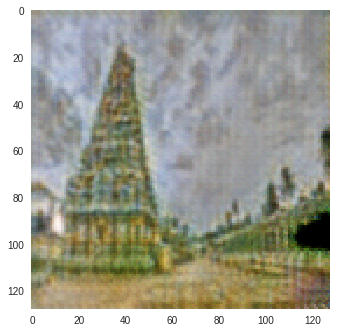
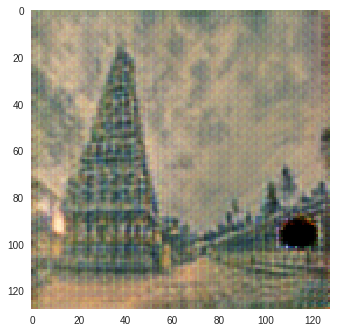
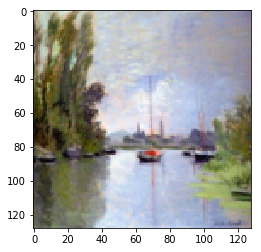
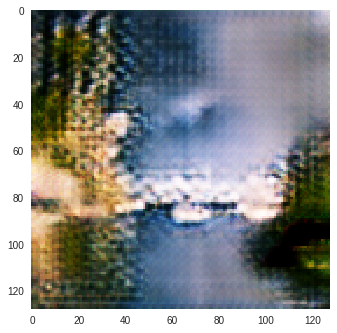
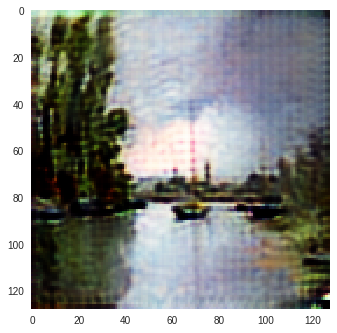
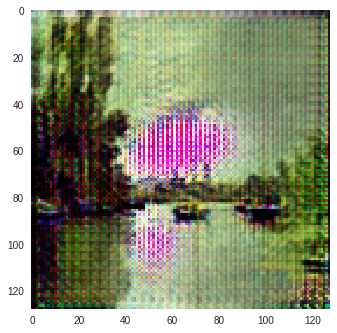
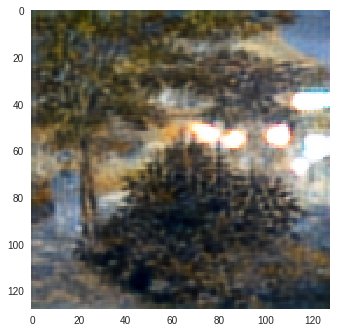
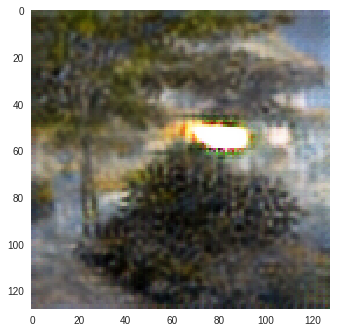
| Input Image | SSIM Image | SSIM + L1 | SSIM + L2 |
|---|---|---|---|
 |
 |
 |
 |
 |
 |
 |
 |
 |
 |
 |
 |
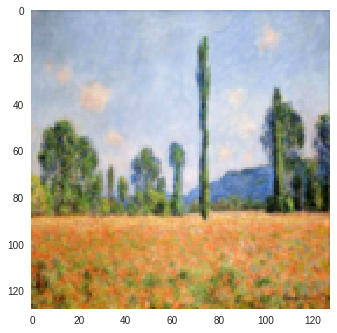
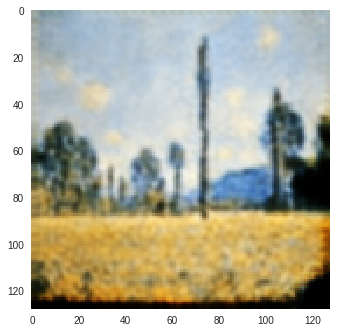
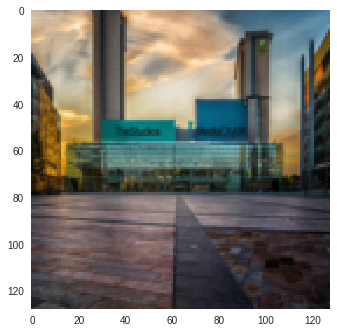
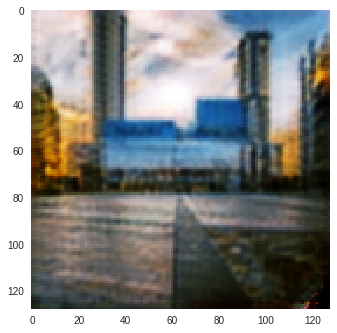
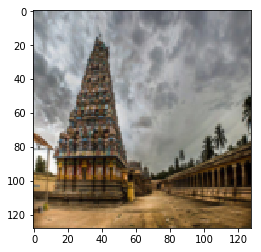
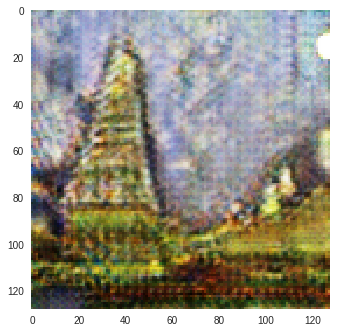
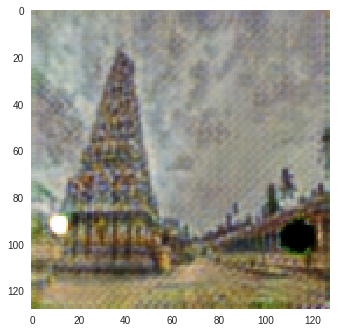
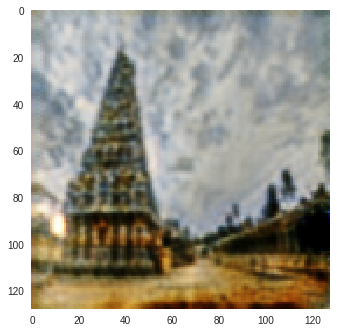
Figure 4: SSIM Color Change (Reconstructions of Input Image produced by CycleGAN model trained on Monet-Photo Database). A variation is observed in the sky color in the SSIM reconstruction of the second input image.
Deep Features as Perceptual Metric
SSIM loss has been well adopted in the industry but it has its own limitations. SSIM loss cannot incorporate large geometric distortions.
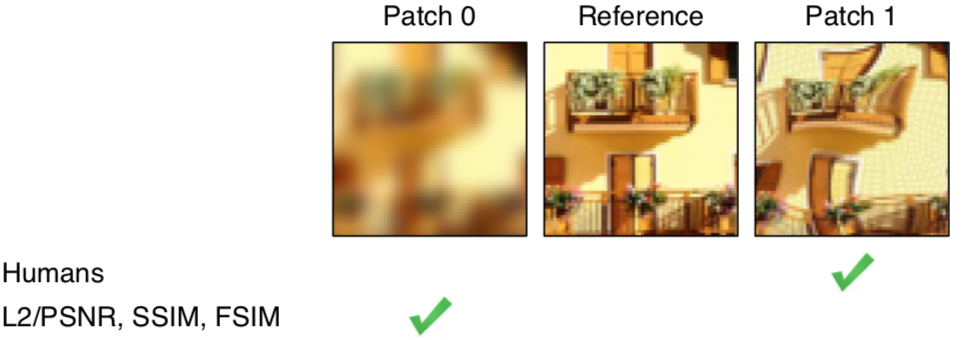
Figure 5: SSIM Index Failure [4]
Finding a linear function which fits the human similarity measure is an onerous task due to the complex context-dependent nature of human judgement.
In light of this problem, researchers in the community have used distance between features of images passed through DL models (VGG, Alex) as a similarity measure between images. Distance between the features is generally calculated as l2 distance or cosine distance.
where is the pretrained DL model (VGG or Alex) and
represents the network layer.
Formula 10: Perceptual Loss [5]
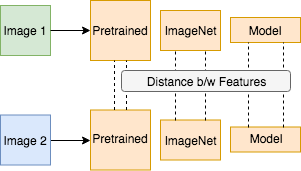
Figure 6: Perceptual Loss
Another loss metric is the recently proposed contextual loss which also measures distances between features computed using DL models. While calculating this metric, features of the reference image and the predicted/test image are treated as two separate collections. For every feature in the reference image feature collection, a similar feature is found amongst the test image feature collection. This is done by calculating the cosine distance between the two feature vectors and then converting that to a similaity value by exponentiating it. Maximum value of this metric is then taken as the similarity value of the two images. Authors of this research paper show promising results on using the contextual loss parameter.
Comparison of different loss functions
I trained CycleGAN [6] model on Monet-Photo database with different loss functions used for calculating the cycle consistency loss. Some sample comparisons are provided below. The project is available here.
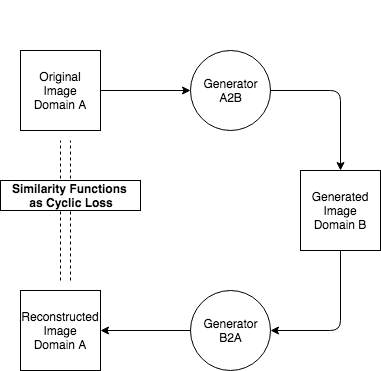
Figure 7: Project Details
Photo to Monet Paintings
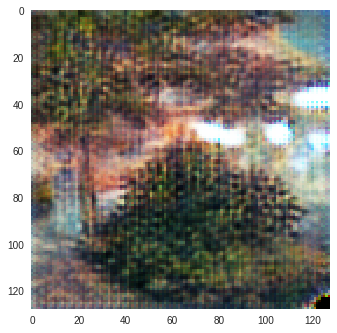
| Input Image | L1 Image | SSIM Image | SSIM + L1 | SSIM + L2(a) | SSIM + L2(b) | SSIM + L1 + L2(b) |
|---|---|---|---|---|---|---|
 |
 |
 |
 |
 |
 |
 |
 |
 |
 |
 |
 |
 |
 |
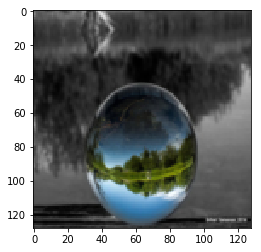
Monet to Photo Paintings
| Input Image | L1 Image | SSIM Image | SSIM + L1 | SSIM + L2(a) | SSIM + L2(b) | SSIM + L1 + L2(b) |
|---|---|---|---|---|---|---|
 |
 |
 |
 |
 |
 |
 |
 |
 |
 |
 |
 |
 |
 |
P.S. - I am implementing perceptual loss using deep features metric in this project. Stay tuned for that.
References
- Wang, Zhou, et al. “Image quality assessment: from error visibility to structural similarity.” IEEE transactions on image processing 13.4 (2004): 600-612.
- Wang, Zhou, and Alan C. Bovik. “Mean squared error: Love it or leave it? A new look at signal fidelity measures.” IEEE signal processing magazine 26.1 (2009): 98-117.
- Zhao, Hang, et al. “Loss functions for image restoration with neural networks.” IEEE Transactions on Computational Imaging 3.1 (2017): 47-57.
- Zhang, Richard, et al. “The unreasonable effectiveness of deep features as a perceptual metric.” arXiv preprint (2018).
- Mechrez, Roey, Itamar Talmi, and Lihi Zelnik-Manor. “The contextual loss for image transformation with non-aligned data.” arXiv preprint arXiv:1803.02077 (2018).
- Zhu, Jun-Yan, et al. “Unpaired image-to-image translation using cycle-consistent adversarial networks.” arXiv preprint (2017).